Drag Mode
This mode allows user to drag the chart to show different section of the chart
To use the drag mode:
2. Hold down the left mouse button and move the mouse until the chart is where you want it.
This mode allows user to zoom in to a particular section of the chart.
To use the zoom mode:
1. Identify the region that you want to zoom in. Make sure  is not selected.
2. Click on the left button of the mouse to set the first date.
3. Move the mouse and click again on the left button to set the second date. (Notice that the
selected region is highlighted as your mouse moved.)
4. The highlighted region gets zoom in.
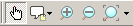
Click on the  or
or  icon found on the Standard Toolbar to zoom in and out of the chart
respectively.
icon found on the Standard Toolbar to zoom in and out of the chart
respectively.
|
Hint:
|
Use keyboard "+" or "-" to zoom in and out of the chart respectively.
|
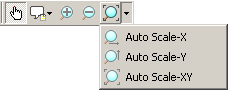
Click on the  icon found on the Standard Toolbar to auto scale the X and Y axis of the
chart.
icon found on the Standard Toolbar to auto scale the X and Y axis of the
chart.
To auto scale individual axis, click  and
select as shown below.
and
select as shown below.
See Also:
 from the Standard Toolbar
and it will be selected as shown.
from the Standard Toolbar
and it will be selected as shown.