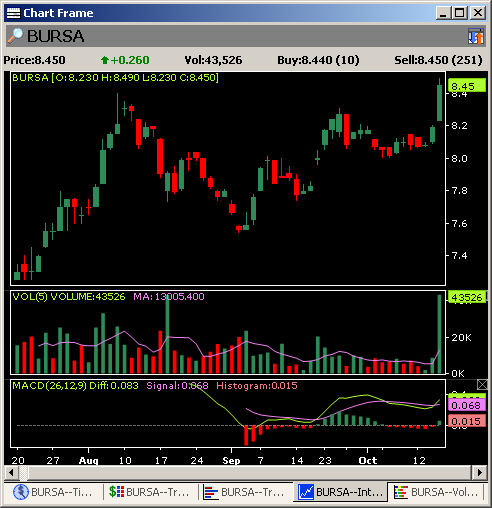
Intraday Charts
Previous Top Next


graphic


Opening the Intraday Charts

Right click on the preferred counter and select Intraday Charts. (See also Opening the Stock Database Menu)

OR
Select the preferred counter and click on the graphic icon from the Stock Database Toolbar.

OR

Select the preferred counter and press F7 from your keyboard.


Explanation

The Intraday Charts are the price and volume charts that show the counter movements throughout the trading day. Its graphical data shows the trading pattern of the counter for the day.
  
Zoom
Reset: Revert to default chart settings. All traded data is displayed.
Zoom Mode: Left-Click once to select start date and Left-Click again to specify end date.
Zoom in + or Press "+" on the keyboard: Zoom In
Zoom out - or Press"-" on the keyboard: Zoom Out
Price Style
Select Line, Candle or Bar charts
Indicators
Turn on any of the Indicators below;
•    3 Moving Averages
•    Bollinger Bands
•    Parabolic SAR
•    Moving Average Convergence Divergence (MACD)
•    Stochastic Oscillator
•    Relative Strength Index (RSI)
•    Price Rate Of Change (ROC)
•    Average Directional Index (ADX)
(Note: Please set the parameter values in the Default Chart Settings)
Mode
Display as;
•    Daily Ticker
•    2 Month Intraday
Interval
Select time intervals. Selection of 1 sec interval is similar to "tick", except that multiple trades that occur within a second, are grouped
Skins
Change the Color Scheme of the chart:
•    Black & White
•    Grey & Black
•    White & Blue
•    White & Green
•    Light Brown
•    Light Green
Show/Hide Panel Info
By default, a pop-up displays the trade information when the mouse cursor is positioned inside the intraday chart. This information includes the time of transaction, the traded price, the volume done, the last done price and the cumulative volume. Uncheck this option to disable.
Show/Hide Grid Line
The grid lines help the user gauge the time of the trades. Uncheck this option, to hide the grid lines
Show/Hide X-Axis
The X-Axis shows the time of transaction. Uncheck this option, to hide.
 
Show/Hide Y-Axis
The Y-Axis shows the prices. Uncheck this option, to hide.
 
Default Chart Settings
 
Right click on the Intraday Chart and select Default Chart Settings to open this window.
You may customize the Intraday charts by checking/unchecking the items in this window.

graphic
Auto Hide feature
The Intraday chart detects the window size. If the window size is too small, the X and Y axes will be hidden. When the Intraday Chart is re-sized to a larger size, the X and Y axes will be restored.